The Role of Domestic Knowledge Pools
In a previous post, I hypothesized that internationality in innovation networks is negatively related to the size of the domestic knowledge pool. Countries with a small domestic knowledge pools can be expected to depend on foreign co-operation in many areas of research, whereas countries with large innovative capacities probably have many of the necessary innovative resource within national borders. This post aims to substantiate this logic with some quantitative arguments.
How to measure the size of knowledge pools?
I assume that the number of annual patent applications is a good measure of a the size of a country’s knowledge pool in a given year. Thus, the independent variable in the subsequent simple linear regression analysis is the count of patent applications per year and per country. Naturally, this is not completely accurate, as countries have different propensities to patent, but the patent count should provide a reasonable estimator. Furthermore, the data was reduced to contain only those countries with a significant patent output. To do this, all countries with less than 20 patent applications in the year 2013 were excluded. 2013 data was chosen to determine which countries to include in the analysis, as it is relatively recent and relatively complete (unlike data for the most recent years).
For simplicity, only inventor data is considered here. The knowledge pool should be best represented by the inventors residing in a given country, not the companies that operate in the country.
Analysis
The histogram of patent application counts per country in the year 2013 is strongly right-skewed. There a many countries with small patent output and very few countries with very large patent output.
library(ggplot2)
#dispdata is a previously created dataframe that contains patent count and dispersion data
attach(dispdata)

qplot(count_inv[year == 2013], geom = "histogram", binwidth = 500, col = I("black"),
      xlab = "patent applications in 2013", ylab = "count",
      main = "Distribution of patent applications per country (2013)")
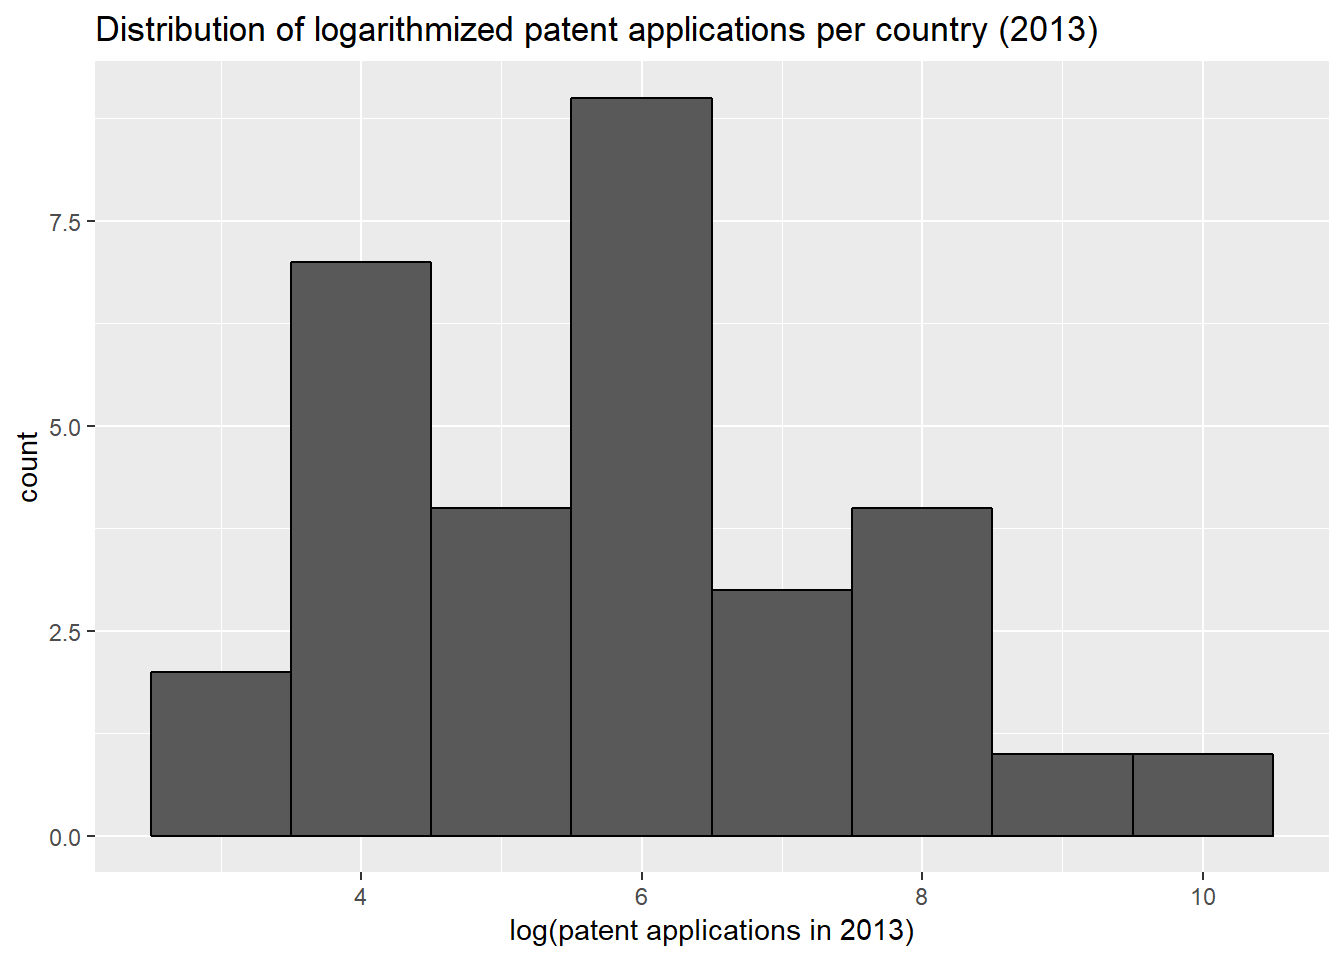
The logarithmic transformation of the patent count approximates the normal distribution and is therefore more suitable for the linear regression analysis.
qplot(log(count_inv[year == 2013]), geom = "histogram", binwidth = 1, col = I("black"),
      xlab = "log(patent applications in 2013)", ylab = "count",
      main = "Distribution of logarithmized patent applications per country (2013)")
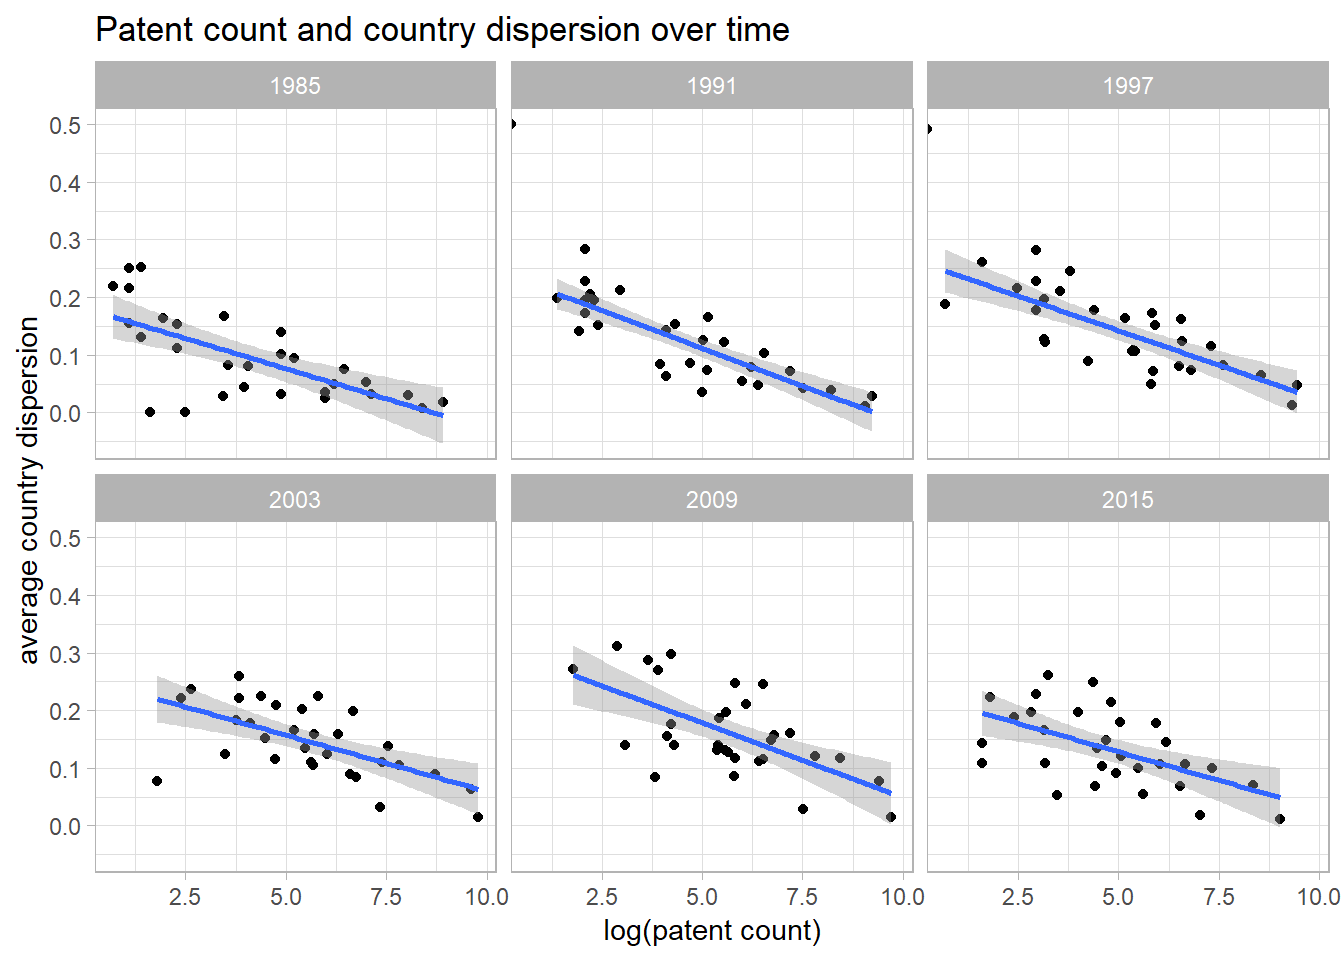
As the relationship between the size of national knowledge pools and internationality is investigated per year here, a series of annual regression analyses serves to illustrate the persistence of the hypothesized relationship over time. The below series of scatterplots with fitted regression lines showes that there is a clear negative relationship between countries’ patent count and average annual country dispersion.
ggplot(data = dispdata[year %in% seq(1985, 2015, 6), ], aes(x = log(count_inv), y = invd)) +
  geom_point() +
  geom_smooth(method = 'lm',formula = y~x) +
  facet_wrap(~ year, ncol = 3) +
  xlab("log(patent count)") + ylab("average country dispersion") +
  ggtitle("Patent count and country dispersion over time") +
  theme_light()
The following graph illustrates the relationship in 2013 in more detail and visualizes the positions of individual countries in the scatterplot.
library(ggrepel)

ggplot(data = dispdata[year == 2013, ], aes(x = log(count_inv), y = invd, label = country)) +
  geom_point() +
  geom_smooth(method = 'lm',formula = y~x) +
  geom_text_repel() +
  xlab("log(patent count)") + ylab("average country dispersion") +
  ggtitle("Patent count and country dispersion in 2013") +
  theme_light()
| Estimate | Std. Error | t value | Pr(>|t|) | |
|---|---|---|---|---|
| (Intercept) | 0.2774 | 0.03495 | 7.938 | 9.375e-09 |
| log(count_inv[year == 2013]) | -0.02246 | 0.005783 | -3.885 | 0.0005466 |
 The negative relationship is highly significant. The Q-Q-Plot shows that the residuals are approximately normally distributed. Thus the assumption of a linear relationship is reasonable.
Having established the significance of the relationship under investigation, the next step investigates how countries perform in terms of internationality when controlling for the size of their domestic knowledge pools. To do this, the residuals of regression models for the years 2003 to 2013 are calculated and aggregated into an average residual value. Ordering the countries in terms of their averaged residuals shows in how far they differ from the country dispersion values predicted by the regression model
allres <- data.frame(sapply(2003:2013, function (x) {
  model <- lm(invd[year == x] ~ log(count_inv[year == x]))
  res <- resid(model)
  names(res) <- country[year == x]
  return(res)
}))

meanres <- data.frame(apply(allres, 1, mean))
names(meanres) <- "residual_d"

#import a list that contains ISO 2digit country-codes to make the country names explicit
isocountries <- read.csv("../../datasource/2digit ISO country codes.csv")
isocountries <- isocountries[order(isocountries$Code), ]
meanres$country <- isocountries[isocountries$Code %in% row.names(meanres), "Name"]

pander(meanres[order(-meanres$r), c(2, 1)], row.names = FALSE)| country | residual_d |
|---|---|
| Switzerland | 0.09129 |
| Belgium | 0.09007 |
| Singapore | 0.0767 |
| Canada | 0.05237 |
| India | 0.04803 |
| Ireland | 0.04522 |
| Russian Federation | 0.04308 |
| Poland | 0.03315 |
| United Kingdom | 0.0327 |
| Austria | 0.02034 |
| China | 0.01951 |
| Netherlands | 0.01821 |
| Germany | 0.01649 |
| France | 0.009478 |
| United States | 0.006218 |
| Spain | 0.003483 |
| Sweden | -0.01945 |
| Australia | -0.02178 |
| Denmark | -0.02238 |
| Italy | -0.02672 |
| New Zealand | -0.0342 |
| Brazil | -0.0344 |
| Saudi Arabia | -0.03747 |
| Turkey | -0.03942 |
| Norway | -0.04077 |
| Taiwan, Province of China | -0.04281 |
| Japan | -0.04595 |
| Israel | -0.04672 |
| Finland | -0.05372 |
| South Africa | -0.05745 |
| Korea, Republic of | -0.08312 |
The above table shows that countries which perform superior in terms of the internationality of their innovation networks (when controlling for domestic knowledge pool size), are those that have close ties to other large innovators via shared language, culture, and geographical proximity (e.g. Switzerland, Belgium, Canada, Ireland).